Tabla de Contenidos
5. Pandas: Apendices
Tratamiento de datos inválidos
- De una columna , obtener la lista de filas que tiene el valor
NaNoNone. Retorna una array de booleanos.
df.capacidad.isna()
[False, True,  False, True,  False, False, False, False, False, False,
 False, False, False, False, False, False, False, False, False, False,
 False, False, False, False, False, False, False, False, False, False]
- De una columna , obtener la lista de filas que NO tiene el valor
NaNoNone. Retorna una array de booleanos.. Como es un array de booleanos se puede usar para filtrar las filas que son válidas.
df.capacidad.notna()
[True, False, True, False, True, True, True, True, True, True,
 True, True,  True, True,  True, True, True, True, True, True,
 True, True,  True, True,  True, True, True, True, True, True]
- De una columna, borrar las filas que tengan
NaNoNone
new_df=df[df.capacidad.notna()]
- De más de una columna, borrar las filas que tenga
NaNoNone
df[(df.tipo.notna()) & (df.capacidad.notna()) & (df.precio.notna())]
- Rellenar los valores que tengan
NaNoNonecon la media de su columna
df.fillna(df.mean(),inplace=True)
new_df=df.fillna(df.mean())
- Rellenar los valores de una columna con
NaNoNonecon un valor
df['tipo']=df.tipo.fillna("Desconocido")
- Rellenar los valores de una columna con
NaNoNonecon la media
df['precio']=df.precio.fillna(df.precio.mean())
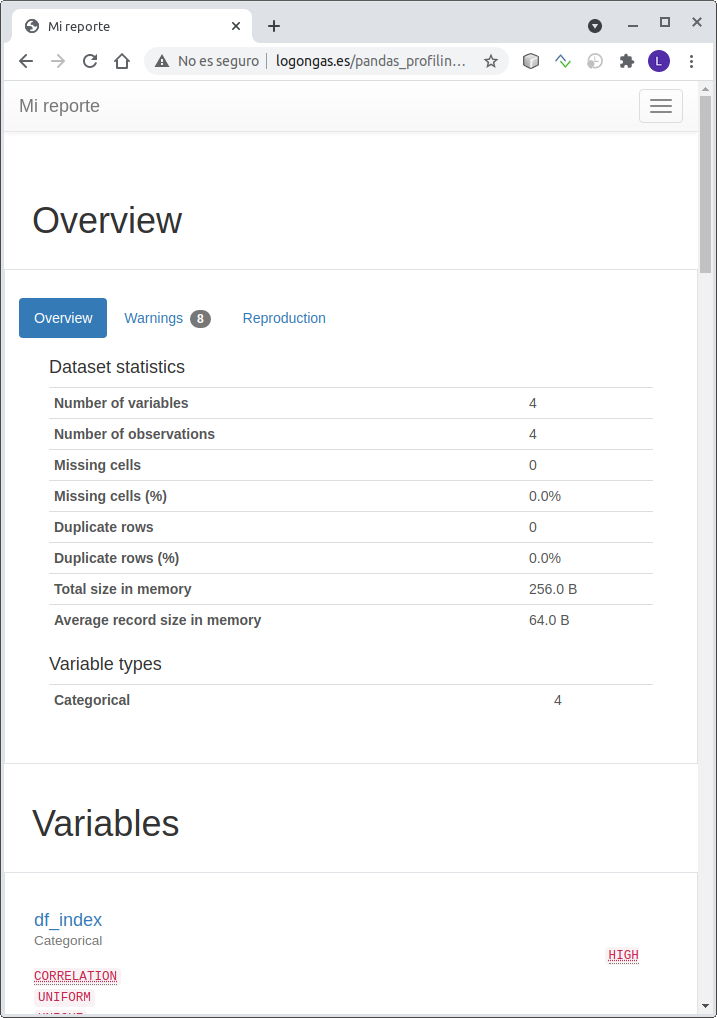
pandas_profiling
Genera un HTML con información del DataFrame
from pandas_profiling import ProfileReport
reporte = ProfileReport(df, title = "Mi reporte")
reporte.to_file("reporte.html")
Se puede ver el resultado en pandas_profiling.html
Una herramienta similar pero mucho mas potente es pywedge. Mas información en Automated Interactive Package for EDA, Modeling, and Hyperparameter Tuning in a few lines of Python Code
Mas información: